

Table of Contents
Menu: Frequency
In the KonText interface menu the item Frequency includes the function for creating frequency distribution. With this function it is possible to get an overview of the types (e.g. of different words) in the search results, along with their frequency. If we wish to find all of the nouns in the genitive case and in the plural form, with this function we can determine which words occur in this particular case and number and how frequently. It is also possible to use frequency distribution to determine the frequency of both the previous and the following units, calculate lemmas in the concordance or determine the distribution of the wanted phenomenon across different text types and their groups (according to the genre, txtype etc.).
Frequency distribution includes both custom (general) settings and quick selection (both are available at the second level of menu).
The function New query → Word list which generally applies to the entire corpus (not only to the specific concordance) allows for similar functionality.
Quick selection of frequency distributions
Lemmas
Assesses the query (KWIC) and lists all of the different types of lemmas (attribute lemma), along with their frequency 1).
Node forms [A=a]
Assesses the query (KWIC) and lists all of the different forms (attribute word case insensitive), along with their frequency.
Doc IDs
Assesses the whole concordance and lists the text names (structural attributes name) in which the wanted phenomenon occurs, along with the frequency of this phenomenon in the individual texts.
Text types
Assesses the whole concordance and lists an overview of the structural attributes 2) which apply to the text type (structural attributes txtype_group, txtype, med, srclang), along with their frequency (the meaning of individual abbreviations is available at the list of abbreviations and codes).
Frequency list
The following example shows how to use frequency list when working with the SYN2020 corpus to search for a query of lemma dřevo ([lemma="dřevo"]): Frequency list of the words of lemma dřevo regardless of case and with a zero frequency limit (using a preset option Node forms [A=a]).
Table view
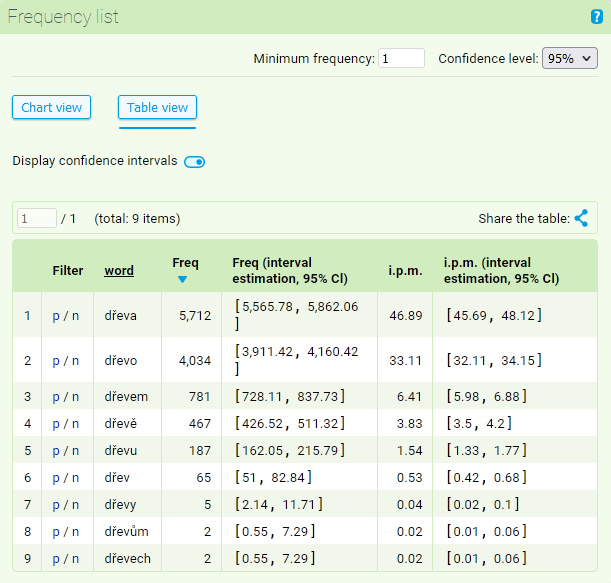
The default display is a table showing the absolute and relative frequencies for each item (including the option to display confidence intervals).
Different kinds of information will appear by every word (attribute) displayed in the frequency list of lemma dřevo. The basic information is located in the frequency column and displays absolute frequency of a given item in the searched concordance (if the concordance was altered in some way before the frequency list was submitted – e.g. with filters – the frequency list will be altered accordingly). All items with at least one occurrence will be displayed in the list. If we want to narrow down the list, we can set Minimum Frequency to a value that suits the specific situation.
The i.p.m. column next to the absolute frequency column expresses the relative frequency of the studied phenomena relative to the total size of the corpus. In our case, the form dřeva appears in the corpus SYN2020 with an absolute frequency of 5,712, which represents 46.89 occurrences per million words (i.p.m.).
For both absolute and relative frequency values, an additional option can be used to display the values of confidence intervals, i.e. the ranges within which the given frequencies (with probability at a specified confidence level) would occur in other, similarly constructed corpora of comparable size. The confidence level is set at 95% and can be changed to 99% or 90%.
In the list to the left from the word, there are located links p/n which can be used for a quick display of positive or negative filter. By clicking on the p in the line displaying frequency for the word dřeva, we filter out this form from the current concordance, in the same way when n is activated, all of the occurrences of the given form will be eliminated from the current concordance.
After clicking on the heading of the column, the table will automatically be rearranged according to the selected column. This way, it is possible to create a list that is arranged alphabetically (in addition to the usual list arranged according to the frequency).
The Share the table function (the link is placed in the row above the table) generates a permanent link to the table, which can be sent directly from the form window to the specified e-mail address or later mentioned in an article, study, etc.
Chart view
The graphical display allows you to visualize the information presented in the previous section (absolute and relative frequencies of items with their confidence intervals) in the form of two types of graphs: either a horizontal bar chart or a “word cloud” graph.
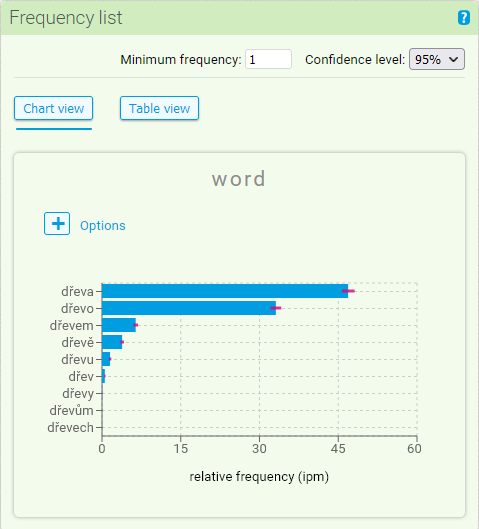
By default, a bar chart with relative frequencies including 95% confidence intervals is displayed.
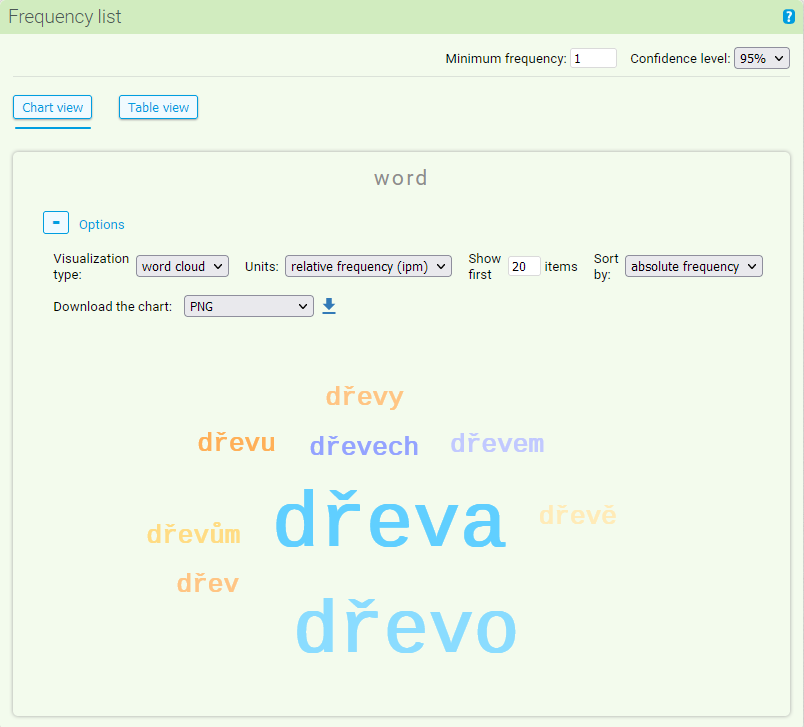
By clicking on the options above the graph using (+) you can modify the properties of the graph. You can display absolute frequencies instead of relative frequency values, limit the number of items in the graph, sort items alphabetically instead of frequency sorting, and export the graph as an image.
Finally, the graph can be switched to a “word cloud,” which displays a group of examined items (in our example, word forms) in sizes corresponding relatively to their frequencies. For this type of graph, only the option to export the graph and limit the number of items in the graph are relevant in the user settings.
Custom settings of frequency distribution
The form which appears after clicking on the menu item Frequency → Custom offers four options:
- multilevel frequency distribution (which can be used to analyze positional attributes) such as word, lemma, sublemma, tag, verbtag, etc.)
- dispersion plot showing the distribution of the searched concordance across the entire corpus
- 2-dimensional frequency distribution reflecting the relationship between two attributes (both positional and structure attributes)
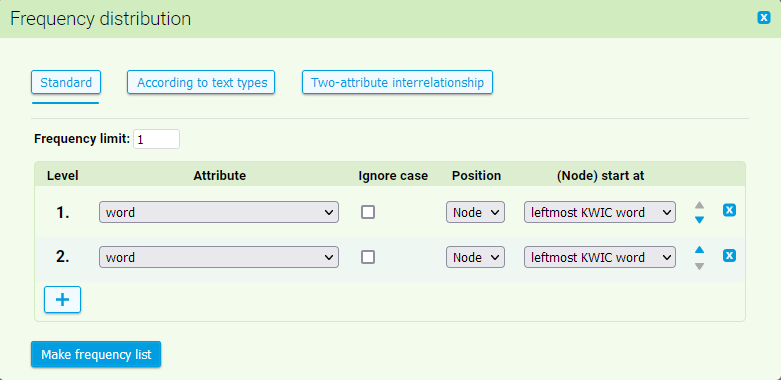
Frequency distribution according to the positional attributes
Multilevel frequency distribution enables us to calculate frequency distribution of any concordance position within the span of 6 positions to the left and 6 to the right from KWIC. At first it is necessary to select in the form which attribute we wish to calculate in frequency distribution (e.g. in new SYN corpora there are available positional attributes ) word, lemma, sublemma, tag, verbtag, lc, pos, case).
Afterwards, it is necessary to select whether frequency distribution should be calculated regardless of the letter case. Selection of the option case-insensitive causes that all of the items are interpreted as having lower case, regardless of what type of case they actually have in the corpus.
In case of custom settings of frequency distribution, we do not need to restrict ourselves to KWIC only (unlike when working with quick selection). It can be calculated from any context position to the right or left from the wanted word. The item position in the form enables us to select not only positions from the left (the preceding) context (6L-1L), but also KWIC itself and positions to the right (the following) context (1R-6R). The numbering of the positions (according to both current and older notation) is summed up in the following table:
| concordance | místnosti | . | Byly | z | těžkého | tmavého | dřeva | a | zlověstně | zaskřípaly | . | Poslepu | jsem |
|---|---|---|---|---|---|---|---|---|---|---|---|---|---|
| position | 6L | 5L | 4L | 3L | 2L | 1L | KWIC | 1R | 2R | 3R | 4R | 5R | 6R |
| position (older notation) | -6 | -5 | -4 | -3 | -2 | -1 | KWIC | 1 | 2 | 3 | 4 | 5 | 6 |
When determining the position of what should be the subject of calculation of frequency distribution, a problem might arise in case when the wanted KWIC is multi-word (e.g. when searching for a phrase dřevo a uhlí). In that case it is necessary to specify which position of KWIC will be the starting one for calculation (whether the right or left one). The item (Node) start at is used to perform this action. The following table sums up how the marking of contextual positions alters according to which end of the multi-word KWIC is selected as a starting point.
| concordance | znečišťování | ovzduší | . | Moderní | kotle | na | dřevo | a | uhlí | splňují | dnes | všechny | požadavky | z | hlediska |
|---|---|---|---|---|---|---|---|---|---|---|---|---|---|---|---|
| position (calculated from the left) | 6L | 5L | 4L | 3L | 2L | 1L | KWIC | 1R | 2R | 3R | 4R | 5R | 6R | 7R | 8R |
| position (calculated from the right) | 8L | 7L | 6L | 5L | 4L | 3L | 2L | 1L | KWIC | 1R | 2R | 3R | 4R | 5R | 6R |
If we wish to create frequency distribution of not only individual units but also pairs of words (bigrams) or even longer phrases, we have to add another level of frequency distribution. Another line will be added to the form with the identical setting options.The quick option of frequency distribution Node forms represents an easier option. - if we apply it to multi-word KWIC (e.g. when searching for two consecutive adverbs such as pomalu a opatrně [tag="D.*"][word="a"][tag="D.*"]), the wanted multi-word expressions ordered according to frequency will appear without any complicated settings.
Provided that we are satisfied with the specification, we may begin the calculation by clicking on the Make frequency list button. All of the items with at least one occurrence will appear in the basic settings. If we wish to narrow the list down, we may set Frequency limit to the value which satisfies the situation.
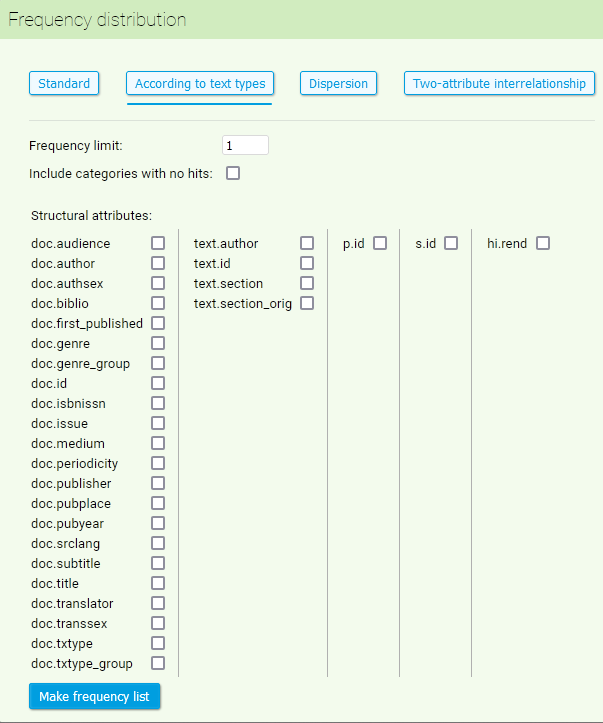
Text Type frequency distribution
The settings of Text Type frequency distribution is located in the second part of the form. It is used only in those cases when the subject of the research depends on what text types do the occurrences in the concordance occur (if we are interested in txtype), srclang, medium etc.).
In the displayed list we may use the mouse to highlight the metainformation whose values we wish to calculate in the frequency distribution. If we select more than one value (by clicking on the Ctrl button), the search will result in more than one list - unlike in the previous case, this is not a multilevel analysis (in which the data from various levels combine), but successive launch of a number of different kinds of frequency distribution which results in a number of frequency lists.
Even in this form we may set the frequency limit, if we wish to restrict the number of results in the list. With the option Include categories with no hits it is also possible to display those attributes in the list which did not appear in the concordance. Lemma dřevo has not once appeared in the songs (txtype SON). Provided that this option is ticked, txtype SON will appear in the frequency distribution even with a zero frequency.
Usage example: frequency list according to text types
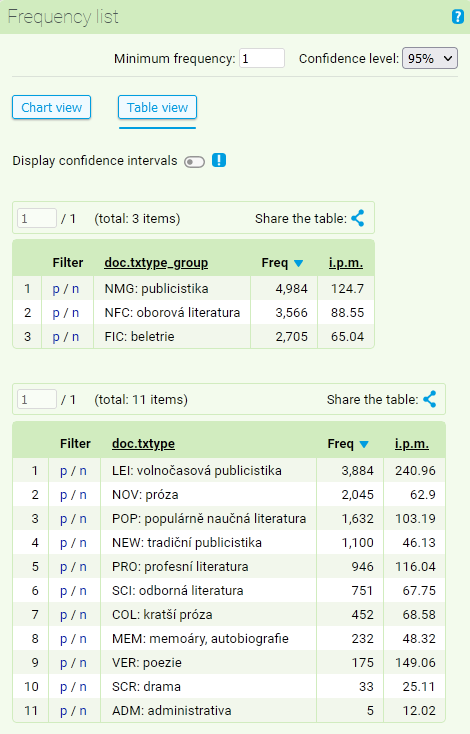
The following example shows how to use frequency list when working with the SYN2020 corpus to search for a query of lemma dřevo ([lemma="dřevo"]): Frequency distribution of the values of structural attributes txtype and txtype_group of lemma dřevo (excluding the values with zero frequency).
The summary of frequency list arranged according to the structural attributes has the same structure as the list arranged according to the positional attributes. Here, the i.p.m. value is of special importance. It conveys the relative frequency of phenomena displayed in the concordance in relation to the overall size of the corpus part with a given value of structural attribute. In our example, lemma dřevo appears in the corpus SYN2020 with a frequency of 3,566 in specialized literature. Considering the overall ratio of specialized literature in the corpus (33%), it accounts for 88.55 of instances per million of words (i.p.m.).
Just like the items, the structural attributes can also be rearranged in the table according to any column. This is especially useful when we need to know the order according to the relative frequency which allows for comparison of the number of occurrences even in the corpora of different sizes.
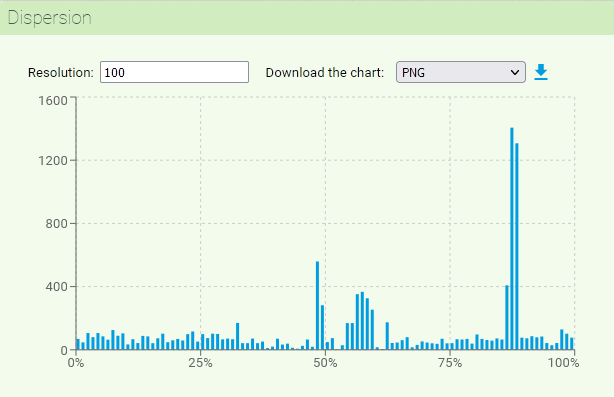
Disperze
The Dispersion function allows you to graphically represent the distribution of a given searched phenomenon across the text/corpus. In the initial form you need to set the number of sections (maximum 1000) into which the corpus will be divided for the purpose of displaying the dispersion. The resulting graph then shows the number of occurrences of the searched phenomenon within each section on the y-axis.
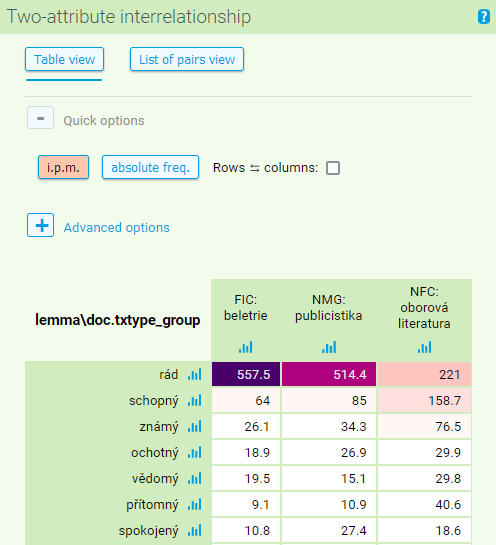
Two-attribute interrelationship frequency distribution
The last type of frequency distribution reflects the interrelationship of two selected attributes (positional as well as structural). As an example, we can look at which nominal adjectives (the so-called short forms, such as rád or schopen: [tag="AC..-.*"], excluding postprepositional forms of the type na živo) are prominent in three basic text type groups. First, choose the Two-attribute interrelationship in the Frequency option in the menu (under Custom) and select two attributes: first, choose lemma (displayed as rows in the table of results), and second, choose doc.txtype_group (among Text types, displayed as columns in the table). You can also adjust the minimal value or percentile of absolute or relative frequency.
After clicking on Make frequency list, a table of results is displayed summarizing the number of occurrences of the adjectives in three selected text type groups (fiction, non-fiction and journalistic texts), sorted by frequency. This default setting can be changed: you can re-sort the table by ipm, switch the orientation of rows and columns or opt for a list of attribute pairs. If you are an advanced user, you can also try to sort the rows based on three criteria (attribute value, the total of absolute/relative frequency in a row or in a column), set the confidence interval (CI) or temper with the color mapping (for further information, see the help question mark next to the Color mapping choice). If you choose the relative frequency display, you can also look at a graph with confidence intervals by clicking on the chart icon next to each variable.
Menu: Query • Corpora • Save • Concordance • Filter • Frequency • Collocation • View • Help


